Realtime(ish) Data From Smart Meters
Adventures in getting high resolution electricity/gas usage data from SMETS2 smart energy meters.
- posted:
- last edited:
Where I live (the UK) smart energy meters have been being rolled out in a pretty big way for a number of years - you can most likely get one installed for free by contacting your energy supplier. Whereas non-smart meters just show a reading on a display on the meter unit, smart meters make gas and electricity readings available remotely over some sort of network. This has various benefits for energy companies and governments, but it also enables a suitably motivated and technical individuals1 to gather data on their home’s energy usage in near-realtime!
Why?
Realtime data like this can be obtained in a number of other ways. The Home Assistant docs give a good overview - they range in levels of hackiness2 but a common approach is to use a CT clamp sensor around the main electric cable and a network enabled microcontroller or embedded computer to send the data somewhere on a network.
This should work pretty well, but requires either quite pricy or quite-hacky hardware, and you have to find somewhere to power it right by your electric meter, which may well be in an awkward location. Also it doesn’t give you anything from the gas meters! Interfacing directly with the meters is a far better solution. So, how do we do that?
SMETS2 smart meter installs (an approximate overview)
After signing up for an install and waiting for a month or so, my energy supplier (Octopus Energy) sent an engineer who installed SMETS2 meters3, the newer of the two generations currently widely deployed in the UK.4 If you get a smart meter install today you seem to be pretty much guaranteed to get one of these. A SMETS2 meter installation has two main means of wireless communication:
- A Wide Area Network (WAN) link to talk to the outside world, which uses cellular 4G/5G or dedicated long range radio5 depending on where you live in the country
- A Home Area Network (HAN) to allow different components of the installation to talk to each other over a short distance, which uses ZigBee.
There are several components that make up a SMETS2 smart meter system.
- Separate gas and electricity meters which are connected between your house and the supply and actually take the readings.
- A “comms hub” which provides the uplink to the WAN and connects to the other parts of the system using the HAN. In my install this is a plug in module on the electricity meter.
- In Home Devices (IHDs). These are the small display units that show real-time energy usage to the people in the property. They talk to the meters using the HAN.
Normally, you don’t have to worry about any of this as a consumer - the engineer doing your install sets everything up and it should all just work, with readings being sent to your energy supplier automatically. The benefits to you will be not having to take manual readings and being able to see your usage on the IHD and possibly your supplier’s app.
Getting low resolution data
So that’s great and all but how do we get data out of it? Does it connect to WiFi? Expose some sort of local API for getting readings?
Sadly, no. That would be way too easy. You can’t just join the HAN with a generic Zigbee module either - it’s pretty locked down.
You can however get your data via a third party.
- If you have a cool energy supplier like Octopus (that has actually put some effort into such things) they may provide a web API for you to fetch your usage data.
- You can actually consent to allow other third parties to access your data, which they then provide to you via an API. Turns out that the central service that UK smart meters talk to (provided by the wonderfully generic “Data Communications Company”, or DCC) allows access by third parties.
In either case, resolution of the data isn’t amazing - it seems like the best available from either source is 30-minute interval readings. For science, I tried out the latter option and downloaded the Bright app. I created an account, provided an identifying code from the bottom of the IHD (this seems to be sufficient to authorize the third party to access your data) and shortly I could see coarse meter readings in the app. Ok then.
Consumer Access Devices (CADs)
Not satisfied with that, I had more of a dig around and found that SMETS2 allows for another type of device - Consumer Access Devices (CADs). These connect to the HAN like the rest of the system, but provide direct access to the meter readings, without having to go via DCC or a third party. Now that’s more like it!
I had a dig around the website of the company behind the Bright app, Hildebrand, and found that they make a combined IHD/CAD which is much more capable than the one my energy supplier gave me. It has WiFi, and even supports sending readings in real time via MQTT. I ordered one, and provided the email I used to register to the Bright app which allowed Hildebrand to authorize the CAD to join my meters’ HAN.
UnHANticipated Problems
One mail delivery later, and I had a second little glowy display sitting in my room. At first it seemed to work flawlessly, it found the HAN and started showing me readings… and then it seemed to get disconnected and just sat there waiting. Funnily enough, the same thing seemed to have happened to the Octopus-provided IHD too. What followed was a series of emails to support for both Octopus energy and Hildebrand.
The Octopus energy support staff didn’t seem to be particularly aware of CADs and were a little slow to respond6. Hildebrand, in contrast, were great and were able to tell me that, quote, “Your local connections are certainly being very ‘moody’”. After some back and forth they were able to kick things remotely, and both IHD/CADs connected and started showing me readings. I was surprised at the level of access they had via DCC - they were able to tell me how many devices were connected and seemed to have quite a in-depth detailed view of the system remotely.
Doing something with the data
Ok, now the stuff that should have worked from the beginning is working, we can actually start doing something interesting. Like a good nerd, I already have an MQTT broker running - so I tapped in its IP address on the CAD, and connected to the broker to see what was being sent:
❯ mosquitto_sub -h 10.23.2.12 -v -t 'energy/#'
energy/<some kind of id>/SENSOR/electricitymeter <a blob of JSON>
energy/<some kind of id>/SENSOR/gasmeter <another blob of JSON>
Hey! Nice. Let’s pipe that into jq to format the JSON nicely.
❯ mosquitto_sub -h 10.23.2.12 -t 'energy/#' | jq
{
  "electricitymeter": {
    "timestamp": "2023-02-08T16:12:16Z",
    "energy": {
      "export": {
        "cumulative": 0,
        "units": "kWh"
      },
      "import": {
        "cumulative": 367.198,
        "day": 6.56,
        "week": 29.39,
        "month": 86.091,
        "units": "kWh",
        "mpan": "<snip>",
        "supplier": "Octopus Energy",
        "price": {
          "unitrate": 0.3506,
          "standingcharge": 0.24014
        }
    "power": {
      "value": 0.38,
      "units": "kW"
    }
  }
}
{
  "gasmeter": {
    "timestamp": "2023-02-08T16:12:01Z",
    "energy": {
      "import": {
        "cumulative": 1600.881,
        "day": 15.187,
        "week": 107.607,
        "month": 327.725,
        "units": "kWh",
        "cumulativevol": 142.673,
        "cumulativevolunits": "m3",
        "dayvol": 15.187,
        "weekvol": 107.607,
        "monthvol": 327.725,
        "dayweekmonthvolunits": "kWh",
        "mprn": "<snip>",
        "supplier": "---",
        "price": {
          "unitrate": 0.1031,
          "standingcharge": 0.23846
        }
      }
    }
  }
}
Ok, now we’re cooking on gas7. Now we just need to yoink the parts we care about into some kind of storage, and from there it’s graph city, baby.
In my case I went with InfluxDB. I picked this over Prometheus, which I also use for other things, because InfluxDB is “push” based (you send it samples of data) as opposed to prometheus which is “pull” based (it reaches out and samples data itself). This felt a lot neater and potentially more statistically legit8 given the CAD is sending us discrete samples already. It also has a companion metrics collector called Telegraf which natively supports getting metrics from MQTT. Great!
Here’s the obligatory diagram:
Nothing special needed to be setup for InfluxDB, but I configured Telegraf to connect to the MQTT broker and to extract the values we’re interested in from the JSON, which it can just do out of the box! Here’s what the config looks like in Nix for use with NixOS:
And here’s the TOML config for Telegraf that gets generated by the above Nix:
To verify that we’re getting the data, we can query InfluxDB using the command line tool:
❯ influx -database energy
Connected to http://localhost:8086 version 1.10.0
InfluxDB shell version: 1.10.0
> select *::field from electricitymeter order by time desc limit 5;
name: electricitymeter
time                cumulative day   month  power price.standingcharge price.unitrate week
----                ---------- ---   -----  ----- -------------------- -------------- ----
1675951418748683192 376.21     5.585 95.105 0.423 0.24014              0.3506         38.404
1675951409215205487 376.209    5.584 95.104 0.425 0.24014              0.3506         38.403
1675951399190143095 376.209    5.584 95.104 0.425 0.24014              0.3506         38.403
1675951389156982956 376.207    5.581 95.101 0.432 0.24014              0.3506         38.4
1675951379125513205 376.206    5.58  95.1   0.422 0.24014              0.3506         38.399
> select *::field from gasmeter order by time desc limit 5;
name: gasmeter
time                cumulative day    month   price.standingcharge price.unitrate week
----                ---------- ---    -----   -------------------- -------------- ----
1675951418762766440 1652.406   19.933 379.245 0.23846              0.1031         159.127
1675951409228079757 1652.406   19.933 379.245 0.23846              0.1031         159.127
1675951399201855765 1652.406   19.933 379.245 0.23846              0.1031         159.127
1675951389168910992 1652.406   19.933 379.245 0.23846              0.1031         159.127
1675951379137998881 1652.406   19.933 379.245 0.23846              0.1031         159.127
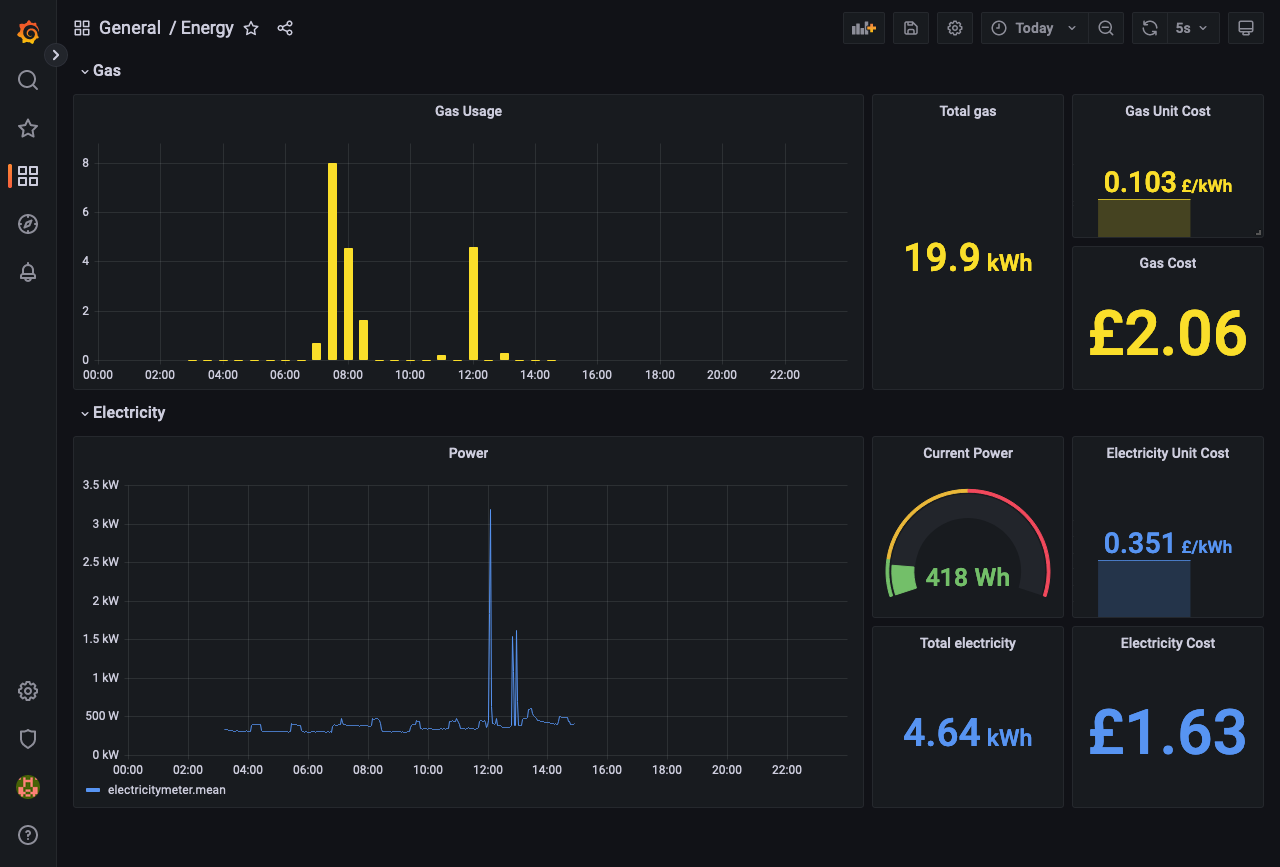
Finally, nice graphs
So, now it’s just a case of making pretty graphs and dashboards out of it. Here’s what I threw together to prove the concept - spot where the kettle was boiled…
Some Closing Thoughts On Openness
I think it’s a poor state of affairs that your only access to the good shit the best resolution data is gated by a third party. Sure, now that I have the CAD I have full access to the data without going via any external service, but the control of actually authorizing that CAD to join the HAN is totally under the control of DCC and third parties that are DCC certified.
There are privacy and usability concerns I’m sure, but in my opinion DCC should at least provide a limited form of this ability directly to individuals with a smart meter at their place of residence or business.
Ideally the meter itself would allow direct, open, read-only access by default - the Dutch seem to have nailed this with the P1 port - a standardised, open connector on their smart meters - which is absolutely how it should be done.
Links
- https://www.smartme.co.uk has a bunch of info on smart meters, going into quite a bit of technical detail.
- You can buy the CAD I used here.
-
That’s us! ↩︎
-
My personal favourite is pointing a camera at the front of the meter and running a computer vision algorithm to read the readout. ↩︎
-
“Smart Meter Equipment Technical Specifications” ↩︎
-
SMETS1 came first, using regular mobile networks as a WAN (with a SIM card!) and had the main drawback that there was no guarantee that your smart meter would remain smart if you switched energy supplier. SMETS2 is a more centrally managed system and solves this issue. ↩︎
-
Which, entertainingly, has to use a slightly different frequency in a very specific part of the UK to avoid interference from a military radar system at RAF Fylingdales. See https://www.smartme.co.uk/smets-2.html ↩︎
-
Understandable and not really a criticism of Octopus, this is hardly a critical problem and the number of customers with CADs can’t be very large… ↩︎
-
Heh ↩︎
-
Statistics nerds weigh in ↩︎